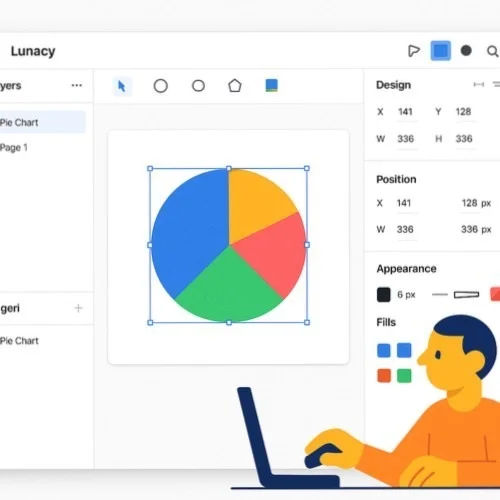
Craft stunning visual representations with Lunacy - the powerful yet completely FREE pie chart generator. Ideal for transforming raw statistics into captivating visuals, slideshows, infographics, plus various imaginative projects using professional-quality features.
Utilize Lunacy's built-in arc editor along with shape functionality to establish the foundation of your circular diagram quickly plus precisely.
Modify segment proportions to represent statistics accurately, then personalize colors, include labels, or incorporate icons to boost visual impact.
Export your finished visualization in multiple formats (PNG, SVG, PDF) or distribute it directly to colleagues through Lunacy's cloud sharing capabilities.
Craft perfectly proportioned circular diagrams using Lunacy's intuitive arc editor. Effortlessly adjust segment sizes to showcase numerical information accurately with exact control over angles. This feature makes it straightforward to produce rings, semi-circles, or complex visualizations with professional-level precision for statistical presentation projects.
Access thousands of icons, illustrations, plus artistic elements to elevate your statistical visuals. Lunacy's integrated graphics library allows you to create pie chart with images, icons, or visual components that transform your statistics into engaging content. Add professional visual touches to your diagrams without jumping between different programs.
Collaborate with team members to develop or refine circular diagrams simultaneously. Lunacy's collaborative features enable seamless teamwork on statistical visualization projects regardless of computing platform. Gather feedback, implement changes, or finalize your presentations while everyone contributes at once - perfect when working on a pie chart from data collected across departments.
Develop or modify circular diagrams on Windows, macOS, or Linux using this cross-platform pie chart making website. Your statistical visualizations work flawlessly across different operating systems, so you'll craft diagrams wherever inspiration strikes.
Construct reusable circular diagram components to maintain consistency throughout all statistical presentations. Build a visualization system once, then effortlessly update all instances when numbers change - saving valuable time while ensuring visual harmony.
Save your completed work in numerous formats including PNG, SVG, PDF, plus others. Select just what you need for presentations, websites, or documents, with options for varying resolutions - making this truly a versatile pie chart creator solution.