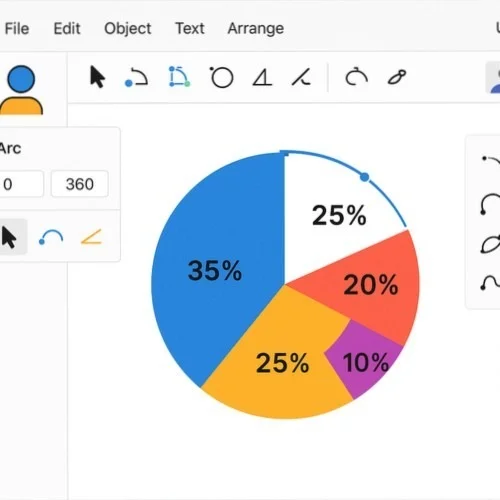
Create a percentage pie chart effortlessly with Lunacy's completely free software

Craft stunning percentage pie charts using Lunacy - our powerful yet completely FREE vector tool. Ideal for visualizing data, enhancing infographics, elevating presentations, plus business reports with precise divisions along with professional styling options.

Lunacy Percentage Pie Chart Creator

How to create a percentage pie chart with Lunacy

Step 1

Create your pie chart base

Begin with Lunacy's shape tools to craft a perfect circle, then utilize our Arc editor to divide it into percentage-based sections.

Step 2

Customize segments and percentages

Modify each section's size to accurately represent numerical values, then apply colors, labels, plus percentage indicators to make visual information clear plus appealing.

Step 3

Export and share your chart

Export finished percentage pie charts in multiple formats or share them directly with colleagues to gather feedback while collaborating.

Precision Arc Editor for Perfect Percentage Divisions

Build mathematically accurate percentage pie charts using Lunacy's advanced Arc editor. Easily split circles into precise percentage segments by adjusting arc angles for each section. Our intuitive on-canvas controls let users visually establish exact percentages while maintaining perfect proportions needed in professional data visualization projects.

Lunacy Arc Editor for Pie Charts

Built-in Templates and Chart Elements

Access an extensive library of pie chart templates plus data visualization elements right within Lunacy. Select from professionally designed percentage pie chart layouts to kickstart projects. Modify colors, dimensions, along with labels while preserving accurate percentage representations necessary for effective communication of statistics.

Pie Chart Templates in Lunacy

Advanced Styling and Export Options

Transform basic percentage pie charts into polished data visualizations through Lunacy's comprehensive styling toolkit. Apply gradients, shadows, or textures to individual sections, develop exploded pie diagrams for emphasis, plus incorporate legends alongside custom icons. Export completed charts in various formats including vector SVG to ensure scalable, high-quality presentations.

Pie Chart Styling in Lunacy

More powerful features for percentage pie charts

Component-Based Chart System

Develop reusable percentage pie chart components maintaining properties across multiple instances. Update numerical information once to watch all chart instances refresh automatically, ensuring consistency throughout presentations plus reports.

Real-Time Collaboration

Work alongside team members on percentage pie charts simultaneously. Collaborate on visualization projects across Windows, macOS, plus Linux platforms, where everyone sees modifications instantly regardless of their operating system.

Interactive Prototype Charts

Convert static percentage pie charts into dynamic prototypes using Lunacy's interactive features. Design clickable sections revealing additional information, animate transitions between different datasets, or craft engaging infographics meant for impactful presentations.

Frequently asked questions about percentage pie charts

What designers say about creating percentage pie charts with Lunacy

Join thousands of designers creating professional data visualizations with our free software.
  • I've tested numerous applications for crafting percentage pie charts, but Lunacy truly stands out through its precision plus flexibility. Their Arc editor makes establishing mathematically accurate segments incredibly simple, while styling options help me produce professional-looking visualizations that clearly communicate statistics. Most impressive is how this comprehensive toolkit remains completely free despite offering such advanced capabilities.

    David M., Data Visualization Specialist
  • Our marketing team switched to Lunacy for all our data visualization needs. Being able to craft percentage pie charts quickly while customizing them to match brand guidelines has proven invaluable. The component system allows us to update information once yet have all visualizations refresh automatically. This has significantly streamlined our reporting workflow.

    Jennifer K., Marketing Analyst
  • Building percentage pie charts for financial presentations was time-consuming until I discovered Lunacy. Now I rapidly construct precise diagrams with exact percentage divisions, apply professional styling touches, plus export them in high-quality formats. Cross-platform support means I continue working on my visualizations whether using my Windows office computer or Mac laptop at home.

    Raj P., Financial Consultant