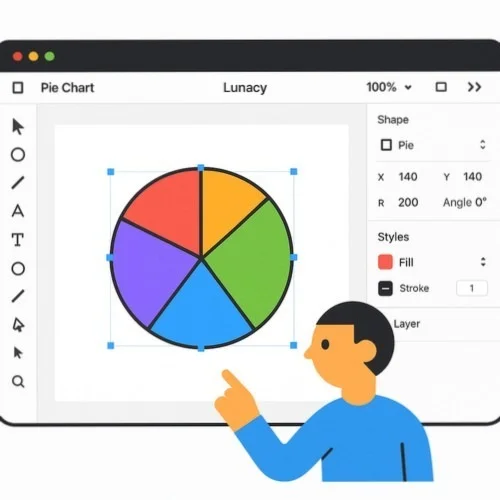
Craft stunning blank pie charts for presentations plus data visualizations using Lunacy - a completely FREE vector graphic tool. Build empty pie chart designs featuring 2, 3, or additional sections utilizing professional tools without recurring fees or hidden costs.
Utilize Lunacy's shape options to form a circle, then transform it into a pie chart through our powerful arc editor allowing precise control over each segment.
Establish how many segments (2, 3, or more) you need along with adjusting their proportions via Lunacy's exact editing capabilities plus Boolean operations.
Add colors, borders, along with effects to enhance blank segments, then export in various formats suitable for slides, documents, or web projects.
Craft precise empty pie chart designs using our powerful arc editing tools. Easily make blank pie charts with exactly 2 or 3 sections by tweaking arc parameters to perfection. These intuitive controls help users produce flawless circular segments ideal for visualizing information, crafting infographics, or building presentation assets without complex math or guesswork.
Browse through an extensive collection of empty pie chart templates right inside Lunacy. Select from various blank circular diagrams featuring different section counts, styles, plus layouts to kickstart projects. Store custom circular graphics as reusable elements to maintain visual consistency across slides, dashboards, along with reports while saving valuable production time.
Turn simple blank pie chart layouts into professional visualization assets through comprehensive styling capabilities. Apply custom colors, gradients, outlines, or effects to individual segments. Include labels, legends, or annotations to improve clarity. Export completed circular diagrams in multiple formats including PNG, SVG, or PDF suitable for slides, websites, or printed materials.
Build beautiful empty pie chart graphics on Windows, macOS, or Linux thanks to Lunacy's multi-platform support. All circular diagram projects work flawlessly across different systems, making team collaboration plus presentation prep simpler than ever before.
Collaborate alongside teammates on circular diagram layouts simultaneously. Multiple team members may edit identical pie chart designs together, making this tool perfect for group visualization projects as well as presentation preparation work.
Develop circular diagram components that function across numerous projects. Modify a pie chart element once, watching all instances update automatically, ensuring consistency throughout information visualizations as well as presentation materials.