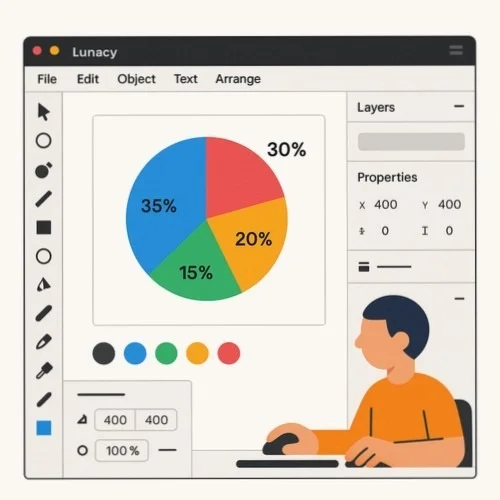
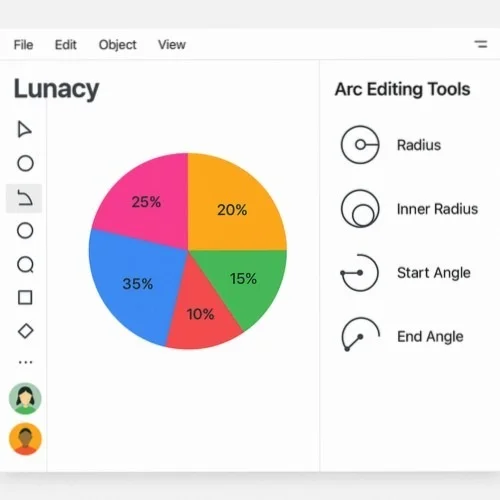
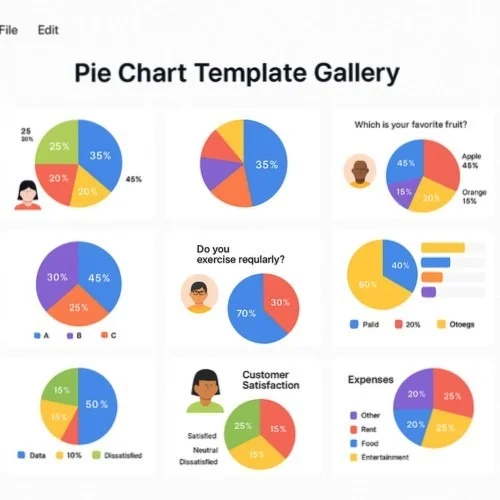
Make your own pie chart with Lunacy's vector toolkit

Build professional, editable pie charts using Lunacy's powerful vector toolkit. Craft percentage pie charts, visual statistics, plus interactive polls without monthly fees. Lunacy offers everything needed to construct custom circular graphs while maintaining precise control over slices, colors, alongside how information gets presented.

Lunacy Pie Chart Creator Interface

How to create custom pie charts with Lunacy

Step 1

Start with pie chart tools

Open Lunacy then utilize Arc Editor to form perfect circles, afterward divide them into exact percentage segments representing statistical information.

Step 2

Customize segments and data

Modify each slice size to display percentages accurately. Include colors, labels, plus numerical values to effectively communicate statistical insights.

Step 3

Export or add interactivity

Save circular graphs across multiple formats or enhance them through interactive elements useful when building polls or live data presentations.

Arc editor for precise pie chart creation

Lunacy's robust Arc Editor makes constructing circular graphs straightforward yet precise. Craft perfect circles then easily split them into exact percentage slices – whether showing 24-hour cycles, 1 in 5 pie chart representations, or complex visualizations containing multiple segments. These intuitive controls allow adjusting each section pixel-perfectly so statistics appear clear plus professionally presented.

Lunacy Arc Editor for Pie Charts

Customizable templates and chart components

Browse various pre-designed circular graph templates to jumpstart statistical projects. Lunacy includes built-in fillable pie chart options featuring editable segments, percentage indicators, alongside professional styling choices. Modify colors, dimensions, or how numbers get displayed to match brand guidelines while maintaining quality visual standards.

Pie Chart Templates in Lunacy

Interactive pie charts for polls and live data

Convert static circular diagrams into dynamic visualizations suitable for pie chart polls, presentations, or real-time statistics. Lunacy's prototyping capabilities let users develop clickable segments responding to visitor interactions. Craft animated transitions, hover effects, plus information-driven experiences that engage audiences while effectively communicating complex numerical relationships.

Interactive Pie Chart Creation in Lunacy

More pie chart creation capabilities

Real-time collaborative editing

Collaborate alongside team members on circular graph designs simultaneously, regardless which operating system they're using. Lunacy's cloud features enable multiple designers to modify identical charts together, ideal when statistical teams need to visualize information collectively.

Component-based chart systems

Develop reusable circular graph elements maintaining consistency throughout statistical visualizations. Build one chart template then implement it across projects, allowing updates to all instances whenever numbers change.

Multi-format export options

Save completed circular diagrams across numerous formats including PNG, SVG, PDF, among others. Generate web-optimized graphics suitable for online surveys, high-resolution images for meetings, or vector files for printed materials—all from single designs.

Frequently asked questions about creating pie charts

What data visualizers say about Lunacy

Join thousands of designers creating professional charts and data visualizations with our free software.
  • I needed custom circular diagrams for client meetings matching our brand palette exactly. Lunacy's Arc Editor provided complete control over sections plus percentages that spreadsheet applications couldn't deliver. Exporting vector formats ensures my charts appear crisp at any dimension, while allowing quick updates whenever fresh statistics arrive.

    Michael J., Data Analyst
  • Our team utilizes Lunacy to build editable pie chart elements for customer surveys plus market research documents. Having professional-grade features completely without cost feels remarkable. I'll craft one template, then quickly modify percentages each quarter without rebuilding entire visualizations. This has saved countless production hours.

    Priya S., Marketing Director
  • After trying numerous applications for statistical visualization, Lunacy delivers perfect balance between precision plus usability. Recently, I needed to construct a complex 24-hour activity diagram containing multiple data points. The Arc Editor simplified creating exact segments, while component systems allowed reusing this circular representation across multiple screens showing different statistics.

    David L., UX Designer