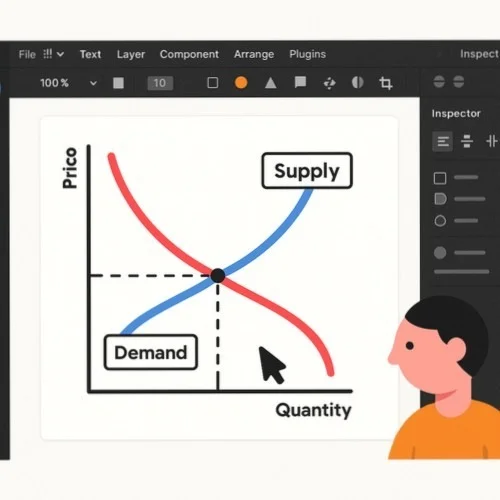
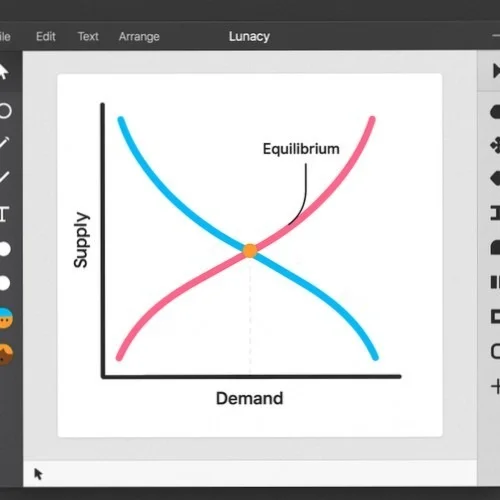
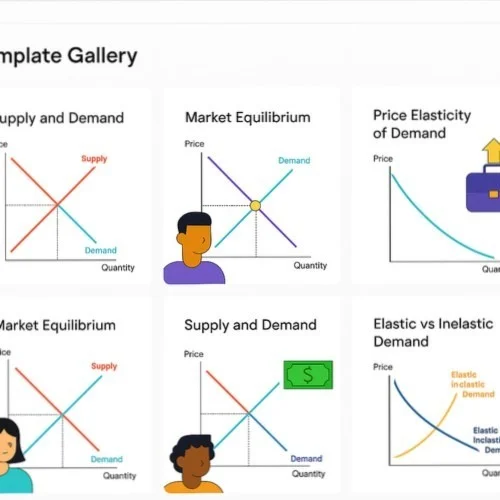
Supply and demand chart creation made simple with Lunacy's free software

Craft clear, visually appealing supply and demand curves, charts, plus economics diagrams using Lunacy - a powerful yet completely FREE vector design tool. Ideal for students, educators, or professionals looking to illustrate economic concepts with precision plus style.

Creating supply and demand charts in Lunacy

How to create supply and demand charts with Lunacy

Step 1

Start with the perfect template

Select from built-in chart templates or develop a custom supply and demand diagram from scratch utilizing Lunacy's precise vector tools.

Step 2

Customize your economics diagram

Insert supply and demand curves, equilibrium points, along with labels through Lunacy's shape tools, pen feature, plus text options to showcase economic concepts clearly.

Step 3

Export and share your chart

Export a supply and demand chart in multiple formats (PNG, SVG, PDF) to enhance presentations, reports, or educational materials, or share directly with colleagues.

Precise vector tools for perfect economics diagrams

Craft accurate supply and demand curves using Lunacy's professional vector editing capabilities. Design smooth lines, perfect intersections, plus precise axes to showcase market equilibrium concepts effectively. The pen tool along with shape editing features ensure economics diagrams maintain mathematical accuracy while looking visually striking.

Vector tools for creating supply and demand curves

Economics templates and chart components

Access a library of economics-focused templates to jumpstart a supply and demand curve chart. Choose from professionally crafted chart layouts, curve shapes, plus economics symbols to build comprehensive diagrams quickly. These resources offer excellent starting points for both simple illustrations or complex economic concept visualizations.

Economics templates and chart components

Interactive economics diagram creation

Transform static charts of supply and demand into interactive visualizations that demonstrate shifting market conditions. Utilize Lunacy's prototyping features to develop educational materials showing how changes in market forces affect equilibrium price plus quantity. Ideal for educators, students, or professionals explaining complex economic theories.

Interactive economics diagram creation

More powerful features for economics diagram design

Cross-platform accessibility

Build or edit a chart supply and demand chart on Windows, macOS, or Linux with Lunacy's cross-platform support. All economics diagrams work seamlessly across different operating systems, making it fantastic for students, teachers, or professionals using various devices.

Real-time collaboration

Collaborate on economics diagrams with classmates, colleagues or study groups simultaneously. Lunacy's cloud documents enable smooth teamwork regardless of location, perfect for group projects, teaching sessions, or professional economic analysis teams working on law of supply and demand drawing tasks.

Comprehensive export options

Save a supply and demand curve chart in multiple formats including PNG, SVG, PDF, plus more. Whether you need high-resolution images for presentations, vector files for publications, or interactive prototypes for educational websites, Lunacy provides all necessary export options.

Frequently asked questions about creating supply and demand charts

What users say about creating economics diagrams with Lunacy

Join thousands of educators, students, and professionals creating economics visualizations with our free software.
  • I've been teaching economics for 15 years, but Lunacy has transformed how I develop visual aids for lectures. The vector tools make drawing precise supply and demand curve charts incredibly simple, plus I quickly produce variations showing different market scenarios. Being completely free means I recommend it to all my students without adding to their expenses - a rare find in academic software!

    Professor James L., Economics Department
  • As an economics major, I'm constantly needing to produce clear charts of supply and demand for assignments plus presentations. Lunacy has been a lifesaver - intuitive enough that I learned it in an afternoon, while the templates give me a professional starting point. Being able to export in different formats ensures my diagrams look perfect whether in papers or slides... honestly wish I'd found it sooner!

    Mia H., Economics Student
  • In my consulting work, I frequently need to illustrate market dynamics with supply and demand charts. Lunacy delivers the precision of expensive design software without the cost. The collaboration features are particularly valuable when explaining economic concepts to clients. I craft interactive diagrams demonstrating shifts in market conditions during meetings, which helps visualize the law of supply and demand drawing connections between theory plus real-world applications.

    David R., Market Analyst

More design tools