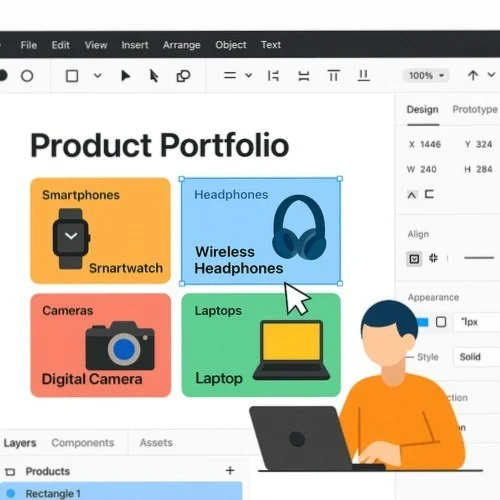
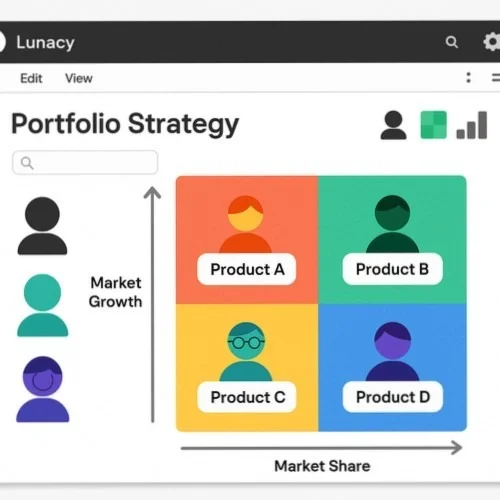
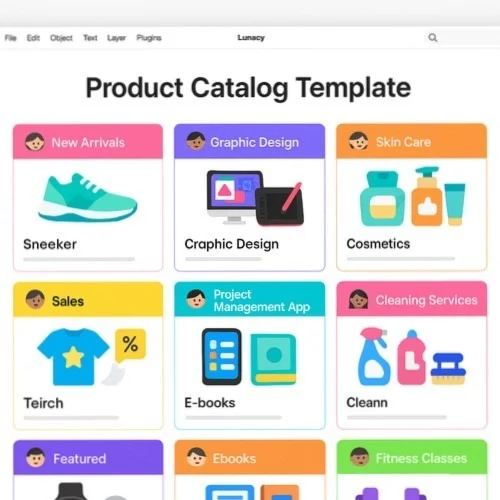
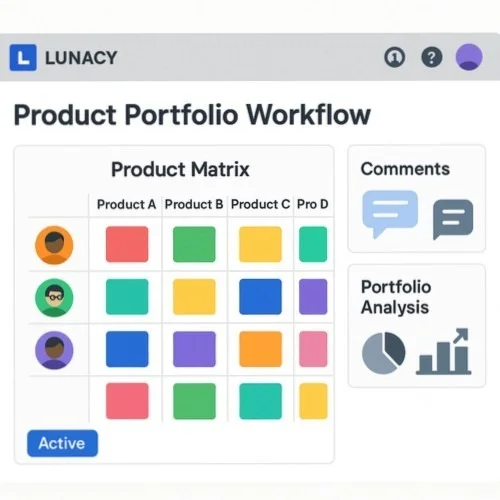
Visualize, craft, plus optimize your collection of items using Lunacy - the completely FREE vector tool. Ideal for managers, marketers, along with designers who need to build professional catalogs, strategic visualizations, or performance dashboards.
Establish frames plus layouts to organize different categories, utilizing Lunacy's auto layout feature to maintain consistent spacing while ensuring proper alignment throughout.
Import item images or use Lunacy's built-in graphics library to craft visual representations, then include performance metrics alongside essential details.
Utilize components along with layers to build interactive matrices, growth charts, or performance visualizations that help identify opportunities in your catalog of offerings.
Build comprehensive visualizations using Lunacy's professional vector tools. Craft BCG matrices, lifecycle charts, plus mapping diagrams that help stakeholders understand strategic directions. The auto layout feature maintains proper spacing as items are added or removed from your portfolio visualization.
Leverage Lunacy's template library to craft stunning catalogs along with portfolio showcases. Organize items with consistent layouts, apply brand identity, while creating visual hierarchies that highlight key offerings. Components help maintain consistency throughout multiple pages plus categories.
Enable cross-functional teams to work together on planning in real-time. Managers, designers, alongside stakeholders might collaborate on analysis, regardless of their operating system. Add comments, share feedback, or iterate on strategies using Lunacy's cloud-based collaboration features.
Build interactive prototypes of dashboards plus catalogs to demonstrate functionality along with user flow. Utilize Lunacy's prototyping features to simulate real interactions, allowing stakeholders to experience how users will navigate through various collections of items.
Utilize Lunacy's shape tools plus components to craft custom data visualizations highlighting item performance metrics. Develop growth charts, comparison matrices, or indicators that make complex portfolio data easy to understand while remaining actionable.
Access your designs on Windows, macOS, or Linux with Lunacy's cross-platform support. Share visualizations with stakeholders regardless of their system, ensuring everyone will view plus provide feedback on strategic planning efforts.