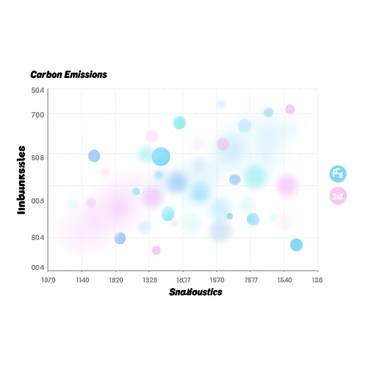
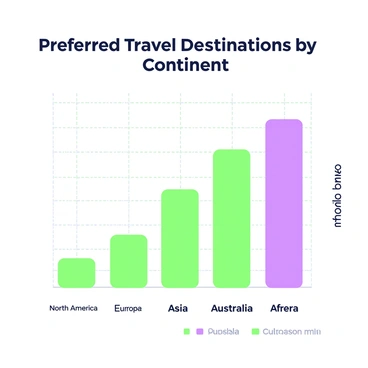
Illustration chart example to enhance data visualization and design skills effectively

The illustration chart example showcases how data visualization can transform complex information into engaging graphics. Using effective design principles, this approach helps communicate ideas clearly. By mastering data presentation techniques, creators can enhance their storytelling capabilities. Whether for business or education, the illustration chart example provides valuable insights into effective communication through visual means, fostering understanding and engagement.

A candlestick chart showing the daily movements of a major stock indexA scatter plot illustrating carbon emissions from various industriesA pie chart depicting the nutritional breakdown of a healthy mealA bar graph showing the preferred travel destinations by continentA line graph comparing temperature changes across four seasonsA colorful bar chart illustrating a company's sales growth over the last five yearsA pie chart showing the types of pets most commonly owned in a countryA world map with bubble charts representing population sizes of different countriesA Gantt chart displaying the timeline for a construction projectA line graph showing trends in global temperature over the last centuryA pie chart showing the distribution of languages spoken worldwideA graph tracking a person's fitness progress with weight and muscle gain linesAn infographic showing the percentage breakdown of different energy sourcesA stacked bar chart illustrating internet usage by age group and device typeA detailed population pyramid showing age and gender distributionAn architectural chart of a city's proposed urban development planA bar chart comparing the market share of different web browsersA histogram illustrating the distribution of restaurant review ratingsA world map with arrows indicating major international trade routesA line graph illustrating the growth of renewable energy capacityA flowchart illustrating the food chain within a forest ecosystemA bar graph comparing customer satisfaction ratings over three yearsA comparison chart showing internet speeds in various countriesA circle chart representing a diversified financial investment portfolioA donut chart illustrating a family's monthly budget allocationA radar chart illustrating market share of different tech companiesAn organizational chart showing the hierarchy of roles within a companyA line graph showing the rise in smartphone sales over the last decadeA bar chart representing the growth of online shopping across age groups
Nothing found in the community