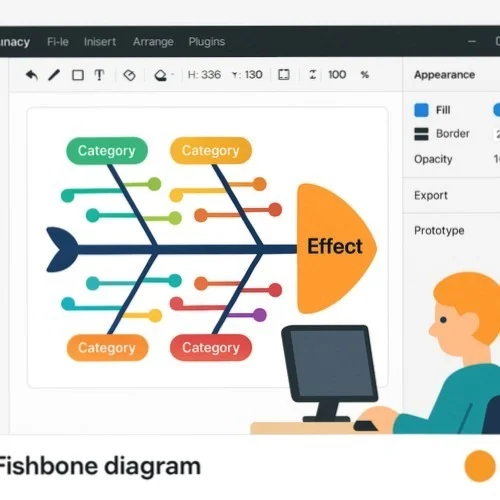
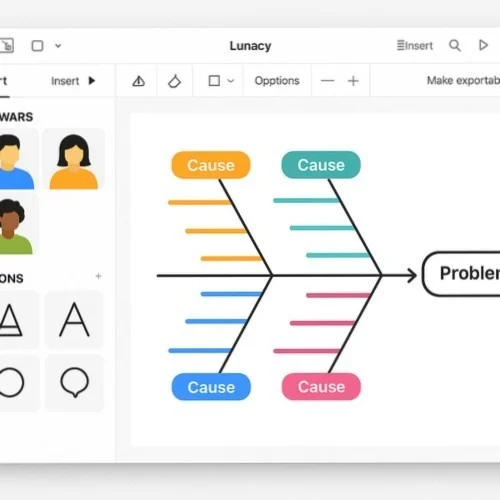
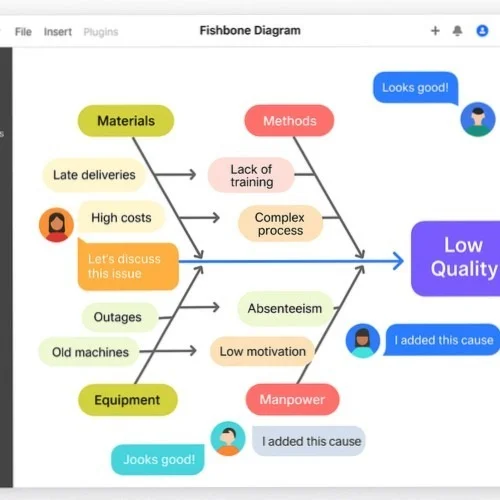
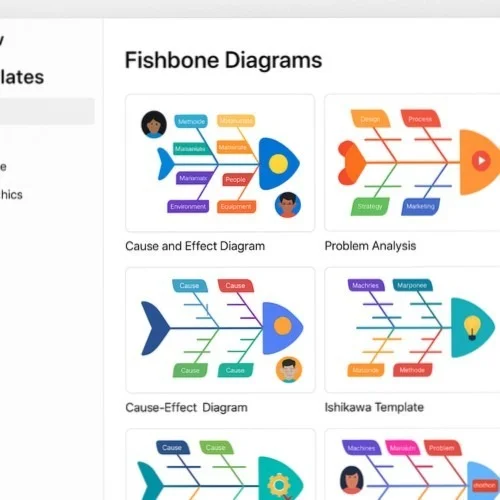
Craft professional fishbone diagrams quickly plus easily using Lunacy - a completely FREE vector graphic tool. Ideal when analyzing cause-effect relationships, solving problems, or managing projects through powerful diagramming capabilities along with ready-made templates.
Select from Lunacy's built-in diagram templates or begin creating fishbone diagram structures from scratch utilizing shape plus line elements.
Utilize Lunacy's vector capabilities to place main categories, sub-causes, alongside labels throughout each fishbone diagram branch while maintaining precise alignment.
Personalize each fishbone layout using colors, icons, plus styling options, then export or share it among colleagues to facilitate collaborative problem-solving sessions.
Develop professional fishbone diagrams through Lunacy's comprehensive vector editing capabilities. Craft perfectly aligned cause-effect branches, include custom shapes alongside connectors, plus organize elements precisely. The intuitive interface makes structuring complex issues into clear visual representations simple, helping teams conduct effective analysis without complications.
Access ready-to-use fishbone layouts along with professionally crafted assets directly within Lunacy. Select from various diagram styles including traditional Ishikawa formats, simplified versions, or customizable templates. Simply drag-drop icons, shapes, plus connector elements to build visualizations faster while maintaining consistent visual hierarchy.
Analyze problems together as colleagues identify root causes through Lunacy's real-time collaboration features. Multiple participants might contribute to identical fishbone visualizations simultaneously, regardless of which operating system they prefer. Leave comments, suggest modifications, or refine analyses collectively to achieve more comprehensive problem-solving results.
Develop or edit fishbone visualizations on Windows, macOS, or Linux through Lunacy's versatile platform support. Each diagram works flawlessly across different systems, making collaboration simple regardless which devices team members typically use.
Enhance every fishbone visualization using thousands of professional icons plus illustrations from integrated Icons8 collections. Insert visual elements representing different factors, categories, or potential causes without leaving the application or hunting online resources.
Share completed fishbone analyses in multiple formats including PNG, SVG, PDF, plus others. Distribute visualizations directly to stakeholders, include them during presentations, or integrate into reports while maintaining professional-quality output throughout.